Measuring product-market fit is more than vibes
A step-by-step guide to measuring product-market fit
Welcome to Product for Engineers, a newsletter created by PostHog for engineers and founders who want to build successful startups.
Product-market fit is the holy grail of early-stage startups.
It’s often described as a magical moment when everything just clicks. You’re growing effortlessly. Users love your product. You are hot shit.
Except, despite what you might hear, product-market fit:
Isn’t magical
Doesn’t happen overnight
Is measurable using real data
This week’s theme is: Measuring product-market fit
1. Define + start tracking your high value events 🔎
Completing each step in this guide could take a few days or several months – it depends entirely on the stage of your product.
If you haven’t already done so, implement a product analytics tool – we know a good one 😉, but any will do.
Next, figure out what your high value events are and start tracking them. Even if you already have analytics set up, it’s worth reevaluating what you’re tracking.
“High value” means events where your users experience the real value of your product, or demonstrate meaningful usage. Logging in doesn’t count.
At PostHog, we track things like:
Insight analyzed – users who create an insight and analyze it
Feature flag launched – users who successfully launch a feature flag
Invited user – users who invite a colleague to use the product
The first two demonstrate meaningful usage of our product. “Invited user” shows someone wants to collaborate with colleagues – a key indicator for any product designed for teams.
High value events for an e-commerce marketplace, like Etsy, could be:
Product listings created – merchants who list a new product for sale
Product shortlisted – customers who add a product to a shortlist
Purchase completed – customers who complete a purchase
A low value event for Etsy would be something like “merchant store created”. It doesn’t matter if merchants create a store if they don’t go on to list products. Therefore “product listings” > “number of merchants”.
Throw these metrics into a dashboard, or a spreadsheet if that’s your thing.
It can be useful to define a North Star Metric – a singular or aggregate metric that defines the health of your product. Just be careful when doing so because choosing the wrong metric can lead to poor conclusions.
Remember: you want to measure meaningful usage. This will be important later.
2. Create an Ideal Customer Profile (ICP) 🧑🍳
To put it another way… who are you building for and why?
Write down their needs and haves. They can be about individuals or groups, like a company. Be very specific. An industry is not specific enough, neither is “companies with more than 100 staff”.
Creating an Ideal Customer Profile was one of the most important things we’ve ever done at PostHog. Originally, PostHog was an open-source product analytics tool only.
This was our first ICP:
Once you’ve created your ICP, identify the user properties you can filter against to isolate users in your ICP – e.g. job title/role, company size, etc. You may need to setup some data capture at signup to get this.
Why is this important? Because you can’t have product-market fit if you don’t understand who (or what) your market is. It also allows you to compare users inside and outside your ICP, which I’ll cover later.
3. Launch a PMF survey 📝
Tracking usage is an important step, but what if you don’t enough data yet? Enter the PMF Survey.
Devised by Sean Ellis, the PMF Survey asks users “How would you feel if could no long use [product]?”.
Users can answer:
Very disappointed
Somewhat disappointed
Not disappointed (it really isn’t that useful)
N/A – I no longer use [product]
Send your survey to users who triggered high value events more than once in the last two weeks or so. Use email or in-app surveys – you can use PostHog’s surveys for the latter.
After benchmarking hundreds of startups, Ellis concluded 40% or more answering “very disappointed” is a strong predictor of product-market fit.
“Those that were above 40% are generally able to sustainably scale the businesses; those significantly below 40% always seem to struggle.”
Repeat this step over and over as you improve your product. If users answering “very disappointed” is trending upwards, you’re on the right track. Superhuman is a classic case study in this approach.
Compare your results for users inside and outside your ICP. Use the results refine your ICP. Don’t stop when you hit 40%.
4. Zoom out on your high value events 📊
If you’ve only just started tracking your high value events, it’s going to take a while to see a useful trend – approx. three months, but maybe a little less.
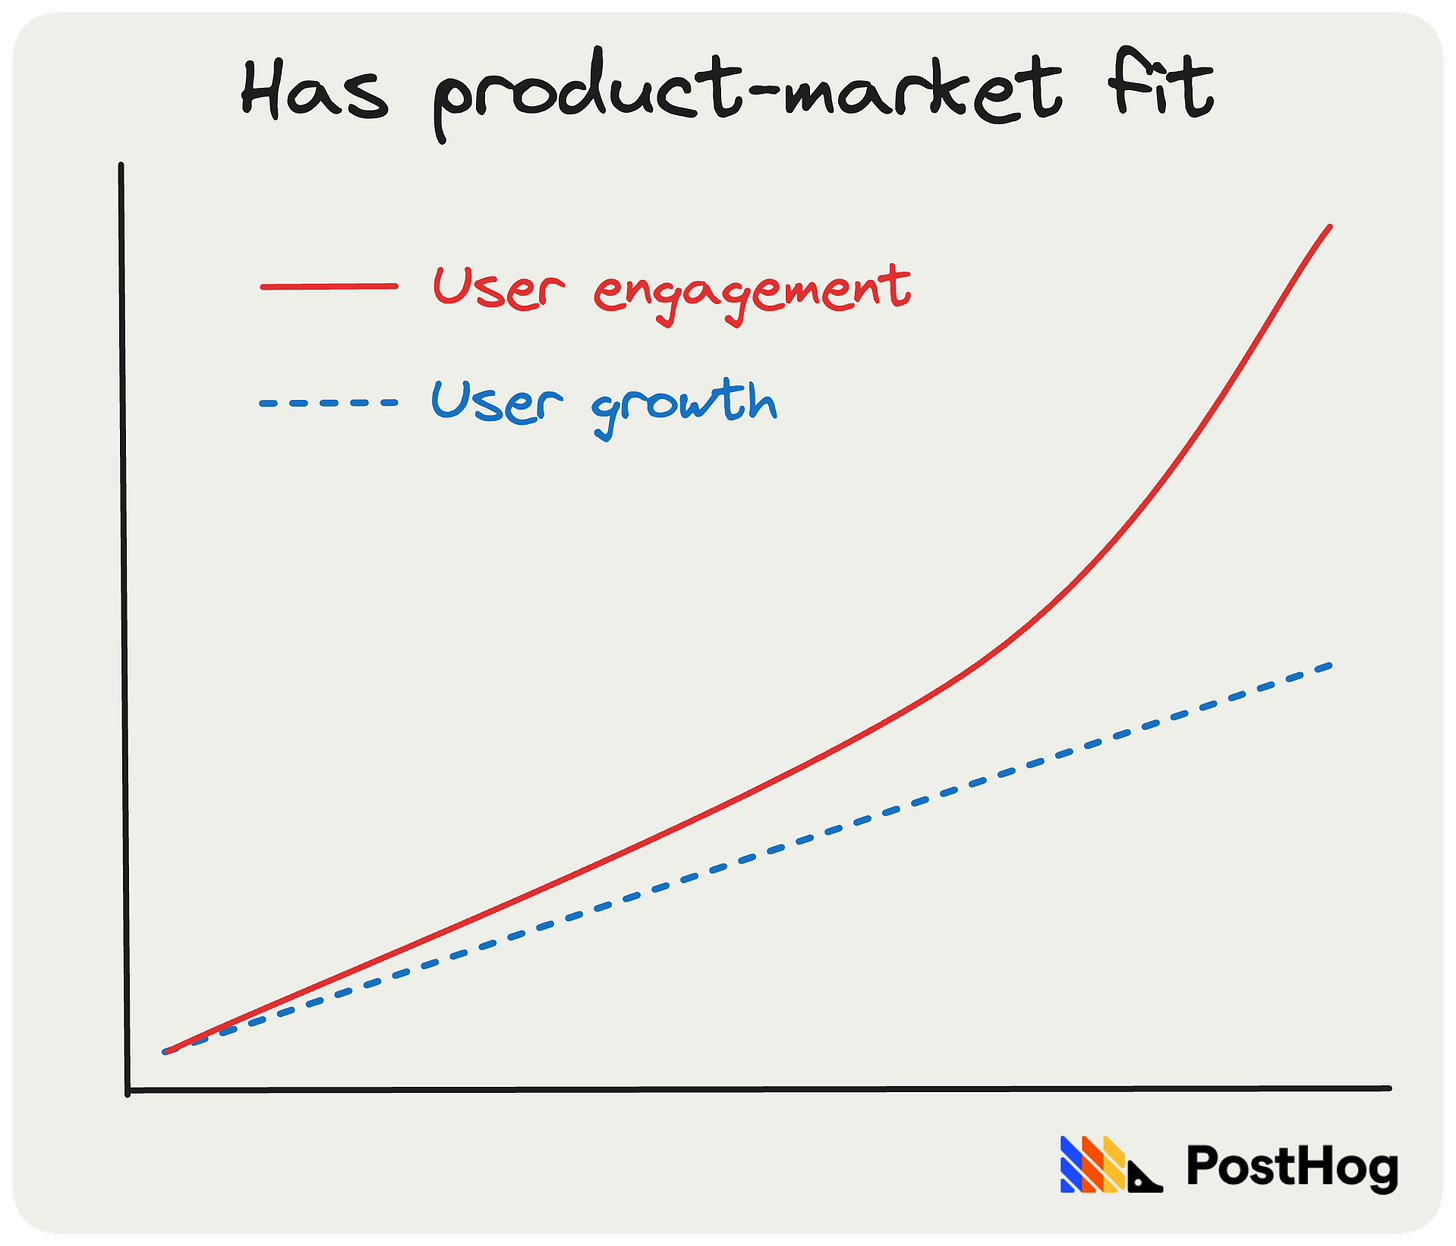
Once you have enough data, zoom out. What does the trend look like? Ideally, meaningful usage should be growing in line with, or faster than, signups.
So, the trend of a company with strong product-market fit might look something like this:
Linear user growth + exponential usage is strong sign you have product-market fit.
In contrast, a lack of product-market fit might like look like this:
This suggests users are signing up, but not sticking around to use the product. User growth is below replacement level, so overall usage is flat lining.
Whatever trend you see here, you can verify it with the next step…
5. Check for signs of retention 🩺
Retention is a vital component of product-market fit.
Create a retention insight in your chosen tool. Configure it to analyze users who performed a high value event for the first time, and did it again within a specific time frame. 8 to 12 weeks is good rule of thumb for a B2B app.
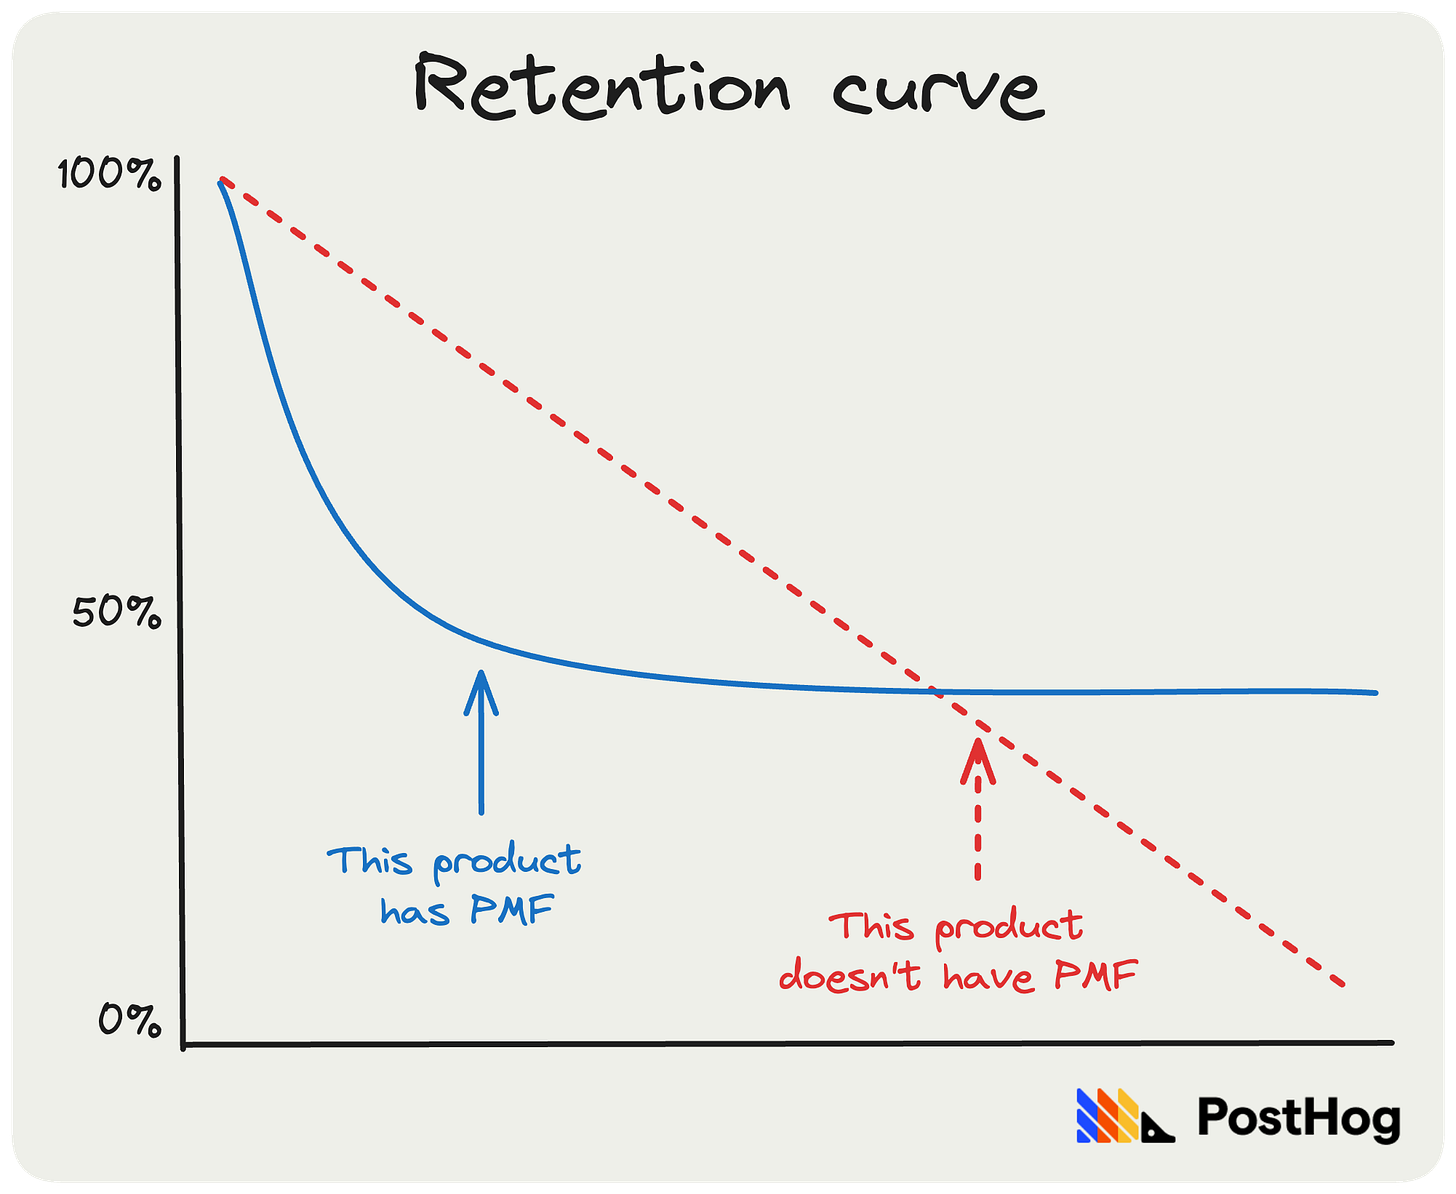
Does retention flatten at any point? If yes, it’s a strong lagging indicator of product-market fit. If not, you have work to do.
What is a good retention rate? It varies significantly depending on the product. 20% or more is a decent benchmark, but a flat line is more important than a specific number… unless the number is 0%. 😢
6. Compare ICP and non-ICP retention ✅
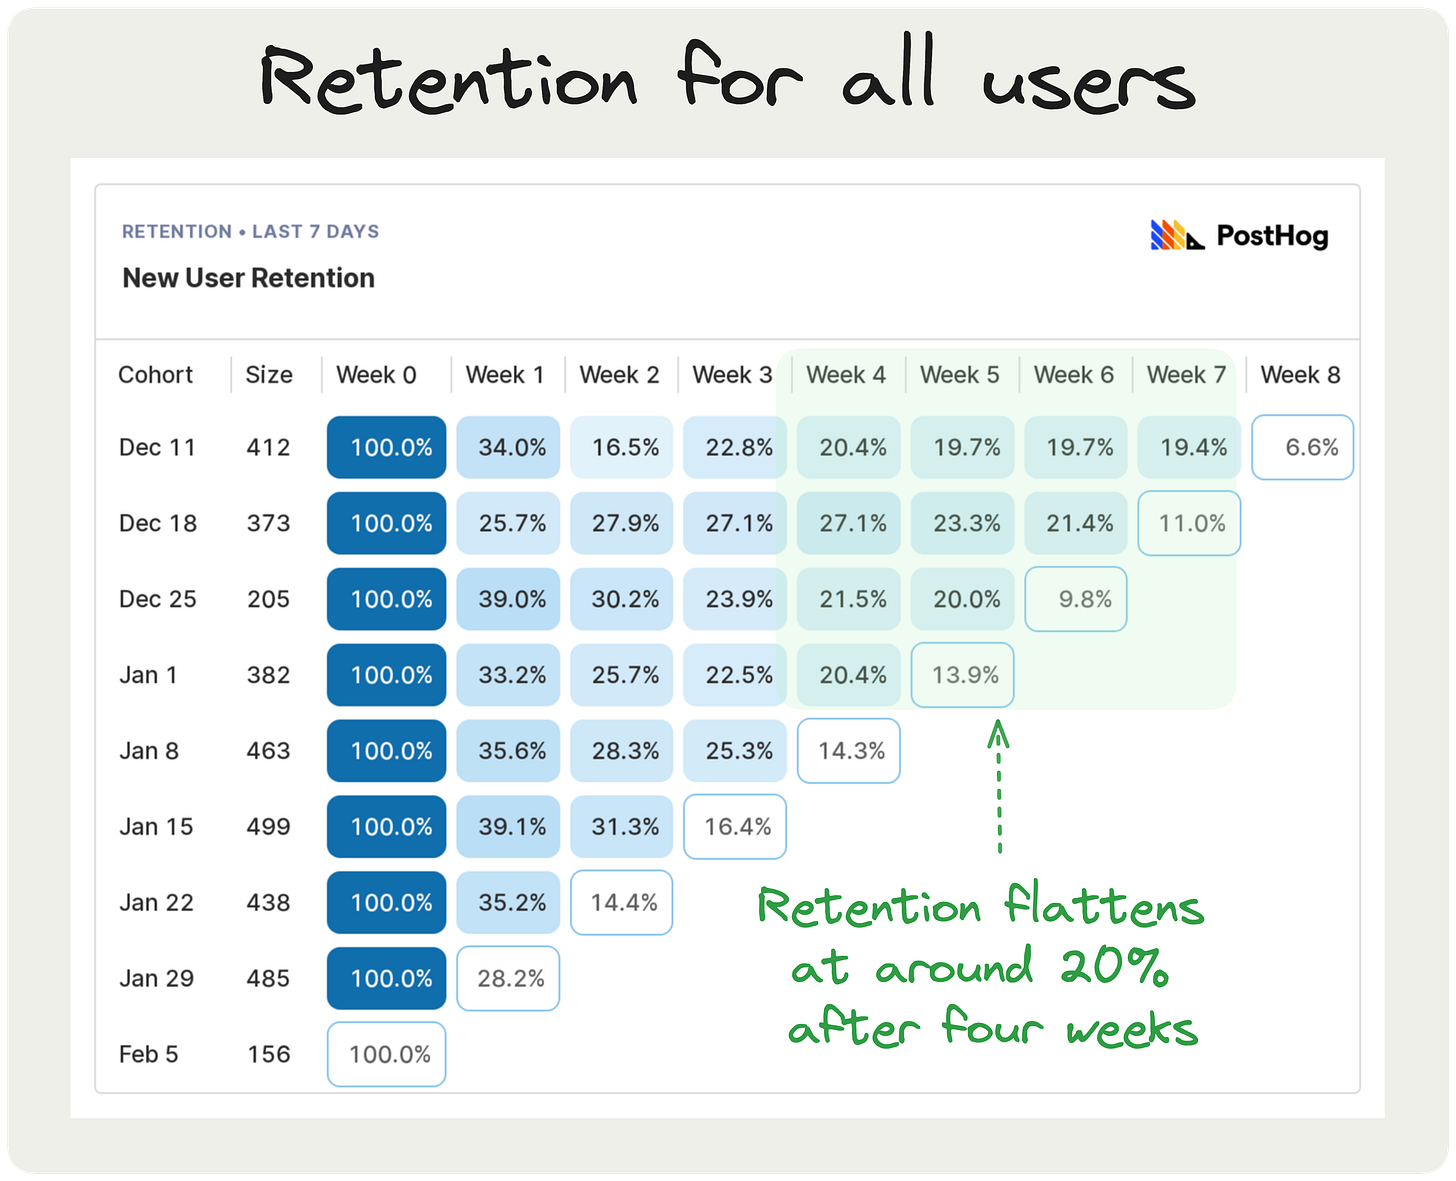
Below is a PostHog cohort retention table for a product that has product-market fit. Any good product analytics tool will produce something similar.
Retention flattens around 20% after four weeks and stays there, give or take a decimal point or two.
Next is a retention table of users inside the product’s ICP. Note retention is higher, hovering around 22% from week 4 onwards.
Finally, here’s a table for users not in the product’s ICP:
There’s still a flattening trend – a good sign of broad appeal – but retention isn’t as strong. It dips as low as 11 to 15% and is less consistent.
These tables indicate a few things:
The product’s ICP is probably the correct.
Users outside the ICP still find it useful. This is worth investigating further.
Some users outside the ICP could be mis-labelled / need reviewing.
Comparing retention between different user cohorts is about the market part of product-market fit. Who is the right market for your product?
Also consider comparing:
Feature retention – are some features stickier than others?
Geographic retention – is retention higher in some regions than others?
Platform retention – are iOS users stickier than Android users?
7. Check for the “PMF Trifecta” 🎉
Coined by Brian Balfour, a former VP of Growth at Hubspot, he defines the trifecta as:
Non-trivial top line growth
Retention
Meaningful usage
“In my opinion, when and only when you have these three things can you say with close to 100% certainty you have product-market fit among a meaningful market.”
Personally, I’d have called it the Triforce of PMF, but that’s just me. 🧝 🏹
Balfour cites the example of Snapchat, which had the good fortune to find product-market fit almost immediately. Within just a few months, it had achieved:
200k app downloads – Non trivial top-line growth ✅
50% of downloads were active daily – Retention ✅
Those 100k users were sending 10 pictures per day – Meaningful usage ✅
The trifecta will look very different for a B2B app vs a social media network, but nailing all three is sure-fire sign you have product-market fit
8. Verify paying customers align with your ICP 💸
You’ve achieved the trifecta and have paying customers. Job done, right? Not quite.
As our CEO, James Hawkins, outlines in his guide to finding product-market fit:
“Well done on getting something sold. However, you can't sell a different product to every customer and call that product-market fit! Can you repeat one of the sales you made four more times?”
In other words, your paying customers ought to look somewhat similar. A massive enterprise has very different needs to a bootstrapped SaaS company. In the long term, you can’t build a product that satisfies both.
For B2B products, James recommends getting to five paying customers in your ICP and growing from there. Consistently selling your product to customers in your ICP is the kind of product-market fit investors will pay attention to.
9. Keep monitoring your PMF metrics 🔁
Product-market fit can drift as your ICP’s needs change, or new products enter the market.
The PMF Survey is particularly useful for tracking how product-market fit changes over time, as Superhuman proved.
For more advice on measuring and finding product-market fit, we recommend reading:
The Product-Market Fit Game – PostHog’s CEO draws on his experience and defines the five levels you must pass to go from a single product idea to strong product-market fit.
First Round Review’s PMF collection – A great selection of case studies on successful companies and how they found product-market fit.
What we've learned about product-market fit – Our earlier, bitesize piece on things we’ve learned about finding product-market fit.
If you enjoyed this post, subscribe. It’s free.
Good reads for product engineers 📚
How to decide what to build – Daniel Gross
”If you want to make something grand, don’t start with grand ambitions. Start small.”
The fallacy of freemium in SaaS – Bobby Pinero
”Introducing more friction… has proven to work better for our business… [it] weeds out people who aren’t serious and creates a sense of urgency.”
7 simple habits of the top 1% of engineers – Engineer’s Codex
How elite software engineers maintain outperformance.
Words by Andy Vandervell, who is in the ICP for Baldur’s Gate 3.


I've always referred to the ICP as "Evangelists" - which I based on the "Innovators" adopter group from Everett Rogers' Diffusion of Innovations Theory (https://www.youtube.com/watch?v=9QnfWhtujPA). These are the folks whose pain is so acute that they don't care how ugly the solution is, as long as it solves their problem. And if you are able to solve their problem, they will shout your praises far and wide, which serves as the best form of marketing. Whenever I advise folks on product strategy, I always make sure that they understand the importance on being laser-focused on the needs of these folks.
Great article.
I have a question. What would be the differences for a low frequency but deep engagement once/twice in lifetime product. For example - A wedding platform or a home purchase portal.